One Probe Every 63 Hours: A Credential Hunt Paced to Be Invisible

Most scanners are loud. This one slept for ten days at a time.
Between September 27 and October 26, a single address — 47.238.126.208, an Alibaba Cloud host in Hong Kong — sent exactly eleven requests to our edge decoys. Same user agent every time. Same Cloudflare colo every time. It walked a wordlist of configuration-file names, one guess at a time, and on its last visit it stopped asking for config files and asked for AWS credentials.
Eleven probes across 28.9 days is 0.38 probes per day. One every sixty-three hours.
The timeline
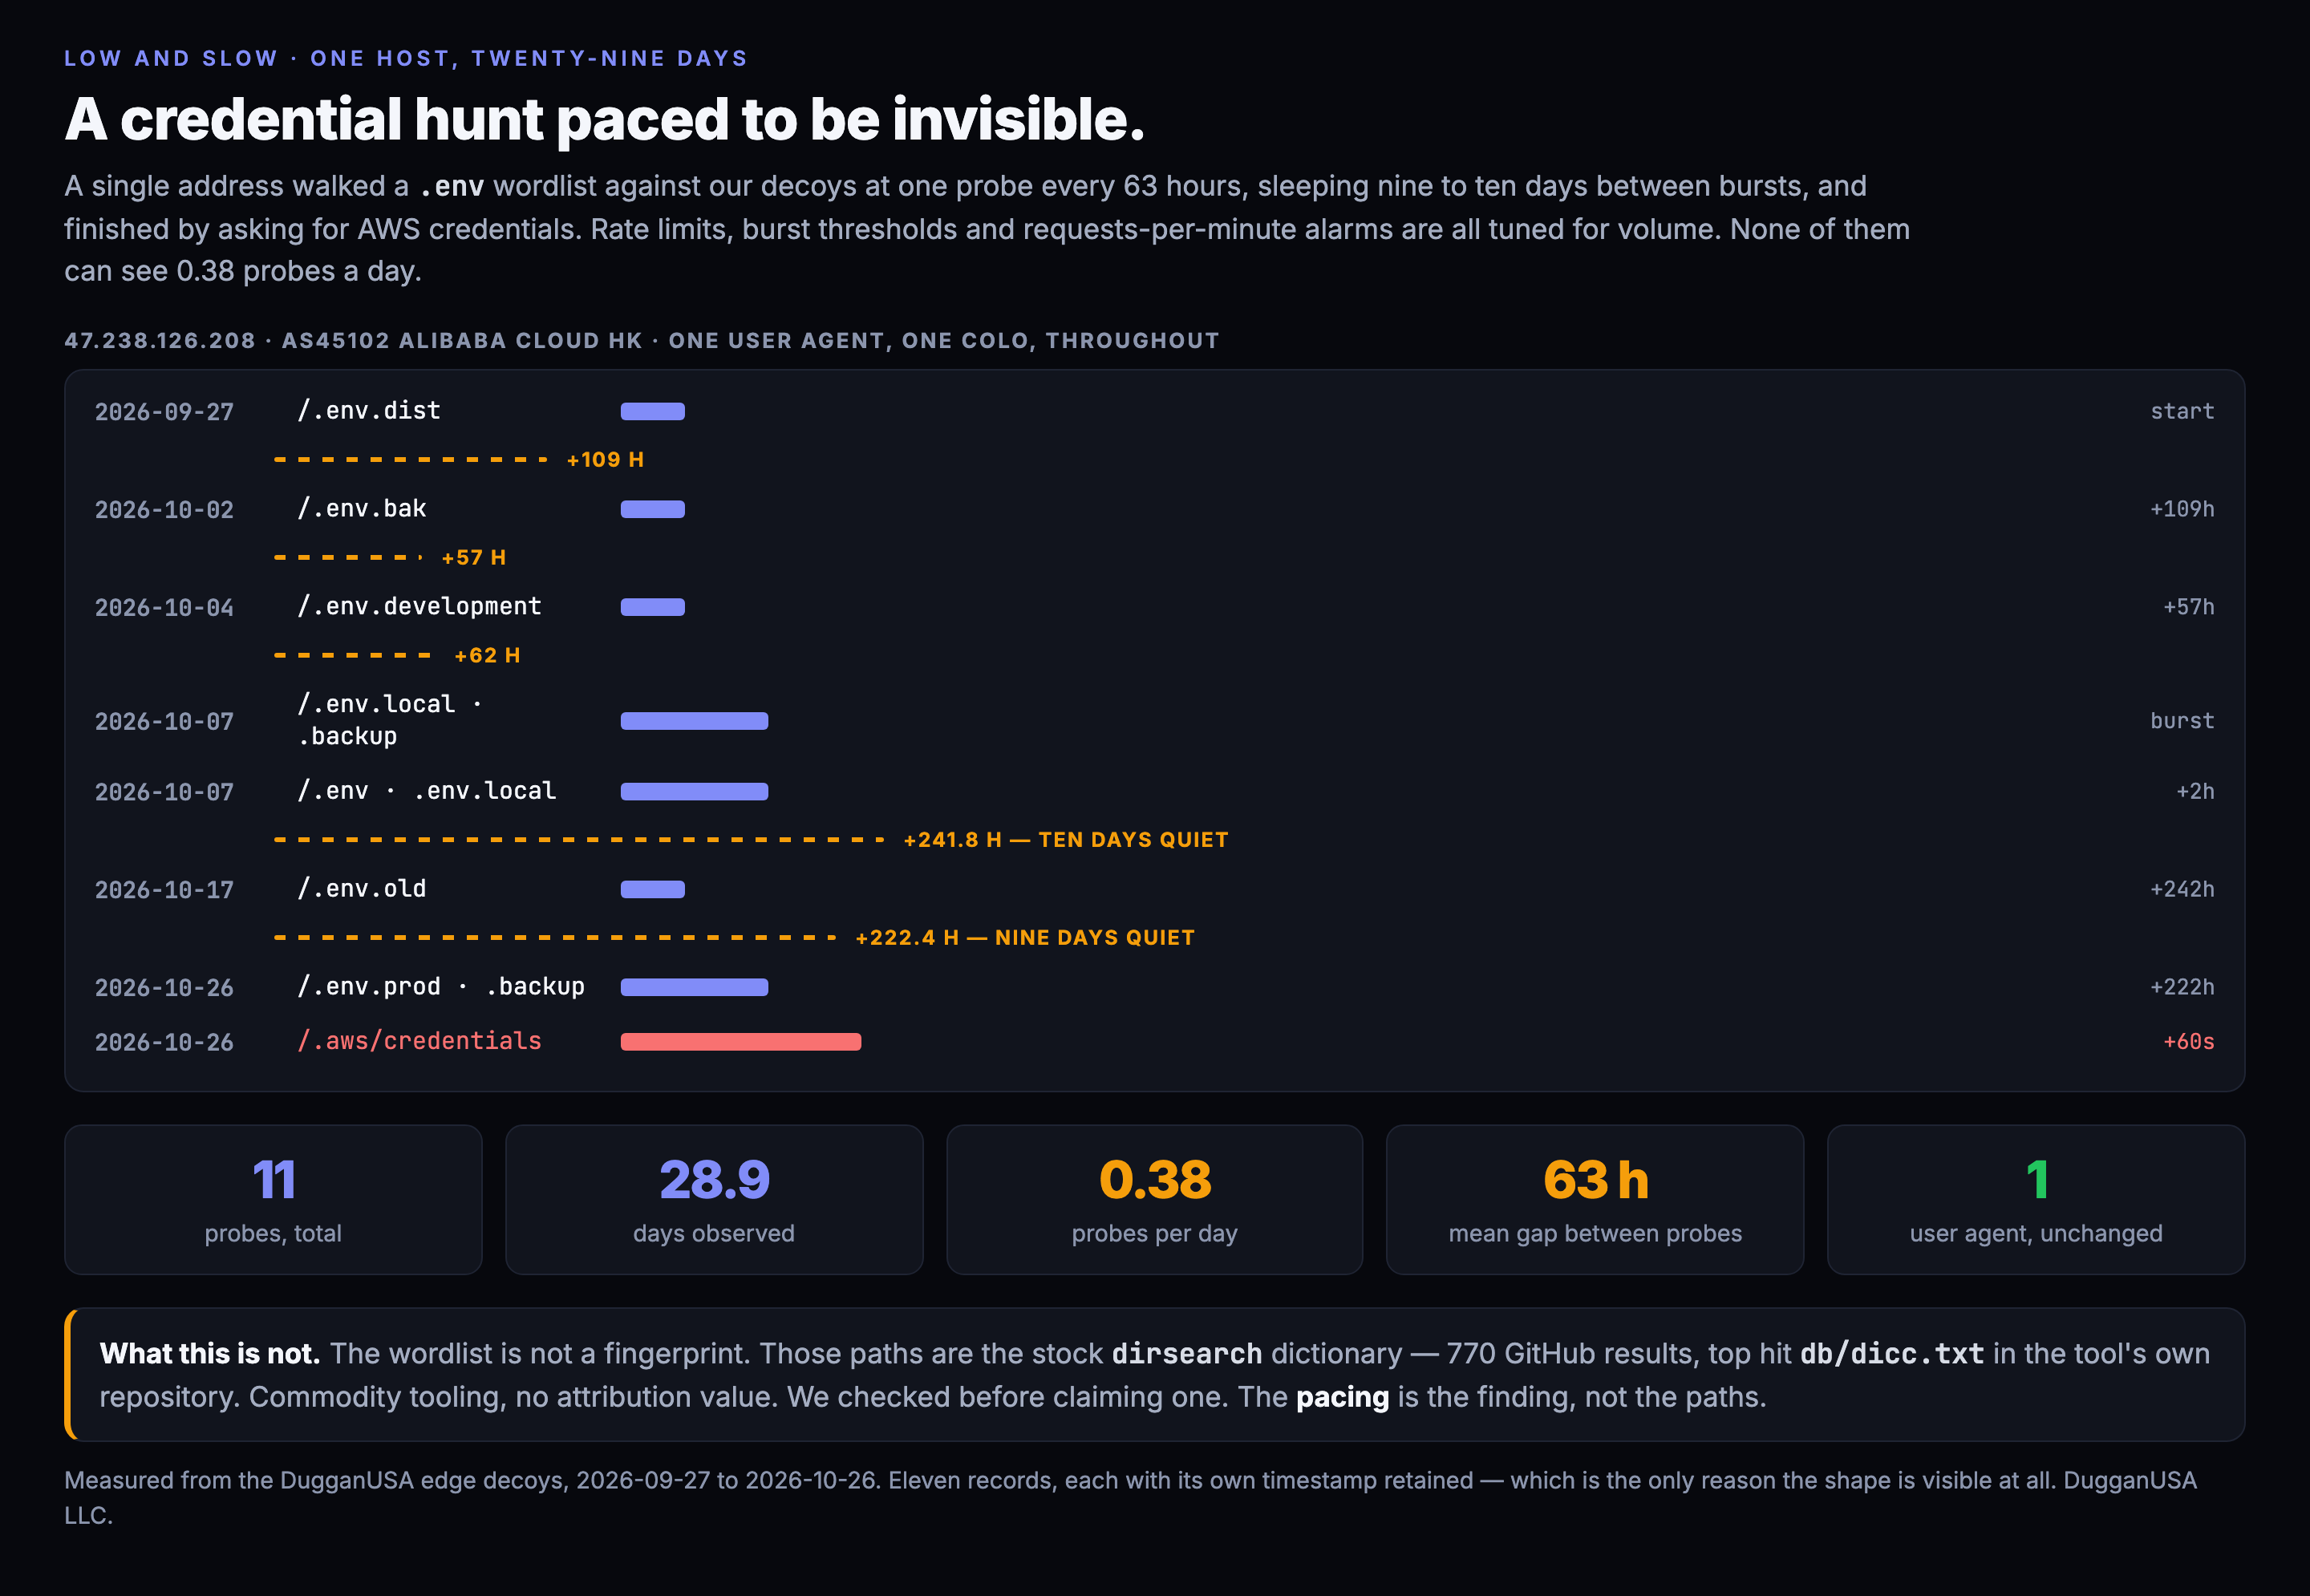
The shape matters more than any single row. It opens with widely spaced single probes — 109 hours, then 57, then 62. On October 7 it tightens into a burst of four inside two hours. Then it goes quiet for 241.8 hours. Ten days of nothing.
It comes back on October 17 for exactly one request, and disappears again for 222.4 hours. Nine more days.
On October 26 it returns and fires three requests in sixty seconds, and the third one is the AWS credentials path.
That is not a crawler. A crawler hits once and moves on. That is not a mass scanner either — mass scanners sweep an address range at speed and never return. This has a scheduler behind it, and the schedule is the interesting part.
Why nothing we normally rely on would catch it
Almost every control a defender has against reconnaissance is a volume control. Rate limits count requests per minute. Burst detection looks for spikes. Web application firewalls score request frequency. Fail2ban style tooling counts failures in a window. Reputation systems weight recent activity.
Set any threshold you like. One request every sixty-three hours sits underneath all of them.
It is also underneath most retention. A great many shops keep edge logs for seven days, some for thirty. A campaign with a ten-day gap in the middle is, to a seven-day window, two unrelated single requests from an address that has never been seen before — twice.
The address does not accumulate a reputation because it never does enough in any window to earn one. Each individual probe is, on its own, completely unremarkable: one GET for a file that does not exist, returning a 404-shaped answer. Thousands of those arrive daily. The eleventh one asks for cloud credentials.
The wordlist is not a fingerprint, and we checked before saying so
The obvious next move is to treat the sequence of paths as a signature. The paths are: .env.dist, .env.bak, .env.development, .env.local, .env.backup, .env, .env.old, .env.prod, and finally the AWS credentials path.
That looked specific enough to hunt. It is not.
We searched GitHub for that combination and got 770 code results. The top hit is dirsearch — one of the most widely used directory brute-forcing tools in existence — and the match is its own default dictionary, db/dicc.txt. The rest of the first page is the usual wordlist collections: fuzzDicts, OneListForAll, bruteforce-lists, leaky-paths.
So the path sequence carries no attribution value whatsoever. Anyone who installs a standard tool gets that exact list in that approximate order. Publishing it as an indicator of a specific actor would have been wrong, and we would have had no way of knowing without looking.
We are putting that in writing because the temptation was real. A list of oddly specific paths feels like a fingerprint. It took one search to establish that it is the digital equivalent of noting that the burglar used a screwdriver.
The pacing is the finding. The paths are off the shelf.
What we can say, and what we cannot
We can say the following, because we measured it: one address, eleven requests, 28.9 days, a single unchanging user agent, a single Cloudflare colo, a 63-hour mean interval, two silences of more than nine days, and a terminal escalation from configuration files to cloud credentials inside a sixty-second burst.
We cannot say who it is. We cannot say whether the operator is a person running a tool occasionally or an automated campaign with deliberate jitter, though the two multi-day silences followed by tight bursts argue for a scheduler rather than a human remembering. We cannot say whether the same operator is doing this to anybody else, because we only see our own doorway.
And we are not going to claim we were first to see it, because the honest answer is that we were the only ones in a position to see it on our own infrastructure — which is not the same achievement.
The bug that would have erased this entirely
Here is the part that should worry anyone running a similar pipeline.
Earlier the same day we gave a job a schedule for the first time. It builds a per-indicator index — one record per address, carrying the first time we saw it, the last time we saw it, and which collection lanes have observed it. It had previously only ever been run by hand.
Putting it on a six-hourly schedule exposed a defect. The write is an add-or-replace, and each run only examines a recent window. On a schedule, every run would have rewritten each record's first seen date to the most recent sighting. Measured on a two-day test pass: 41 of 183 records would have had an earlier date destroyed, silently, automatically, every six hours.
Apply that to this address. A campaign that began on September 27 would have rendered as a record first seen on October 26. The 109-hour gaps, the ten-day silence, the escalation from configuration files to credentials — all of it collapses into a single probe that happened today. The finding does not get weaker. It stops existing.
We caught it before the schedule ran, and the job now merges rather than replaces: earliest first-seen wins, latest last-seen wins, collection lanes union together. But the near miss is the lesson. A low-and-slow campaign is only visible if your history is honest about when things started, and the most dangerous kind of data corruption is the kind that makes your records look tidier than the truth.
What to actually do about it
We do not have a clean detection to hand you, and we would rather say so than invent one.
What we would suggest, in order of how cheap it is:
Keep per-indicator history, not just per-window logs. One record per address with a true first-seen that never moves forward costs almost nothing and is the only structure in which a 63-hour cadence is visible at all.
Measure the gap, not the rate. Rate is requests divided by window, and a long window hides this completely. The interval between consecutive sightings from the same source is a different and much more revealing number. A source whose intervals are measured in days, that keeps returning for a month, is doing something a crawler does not do.
Treat escalation within a source as the signal. The individual requests here are forgettable. The sequence — configuration files for a month, then cloud credentials — is not. That ordering is only computable if you retained the earlier ones.
Do not block the address and call it finished. It is a cloud VM. It costs a few dollars and it is replaced in minutes. The address is in our published feed because it genuinely probed us and because it is the actor's own rented host rather than a shared exit, but the durable thing here is the behavior, not the number.
The accounting
This post makes 19 checkable factual claims. All 19 were measured against our own records before publication: the probe count, every interval, the user agent and colo consistency, the GitHub result count and its top hit, and the 41-of-183 figure from the merge test.
One claim was removed in draft. We initially identified a distinctive truncated user agent shared across several scanners and were preparing to present it as a tool fingerprint. It was an artifact of our own display code truncating the string at eighty characters for readability. The real values were complete and unremarkable. We mention it because the near-miss rate on this kind of analysis is the whole story — two of the three patterns we found interesting today did not survive being checked.
We cap ourselves at 95% on anything. Something in here is wrong, because something always is. When we find it we will say so at this same address.
Eleven requests in a month is not an attack. It is someone being patient, and patience is cheap, and almost nothing we have built as an industry is designed to notice it.
Every indicator in this post is in the feed. Free.
1.58M+ IOCs, STIX 2.1 / TAXII, 88% novel vs ThreatFox, exploited-CVE leads ahead of CISA. No credit card — a free API key in 30 seconds, and you can audit every claim above against the live endpoints.
Get your free key → analytics.dugganusa.com/stix/register
Was this useful? Thirty seconds, no cookies, no tracking, no third parties, your address hashed and never stored. If the box below does not load, the same question lives at https://analytics.dugganusa.com/nps.html?post=low-and-slow-credential-hunt-october-2026