We Read 79 Different Sources to Cover 101 Campaigns. 82% of What They Published Is Not an IP Address.

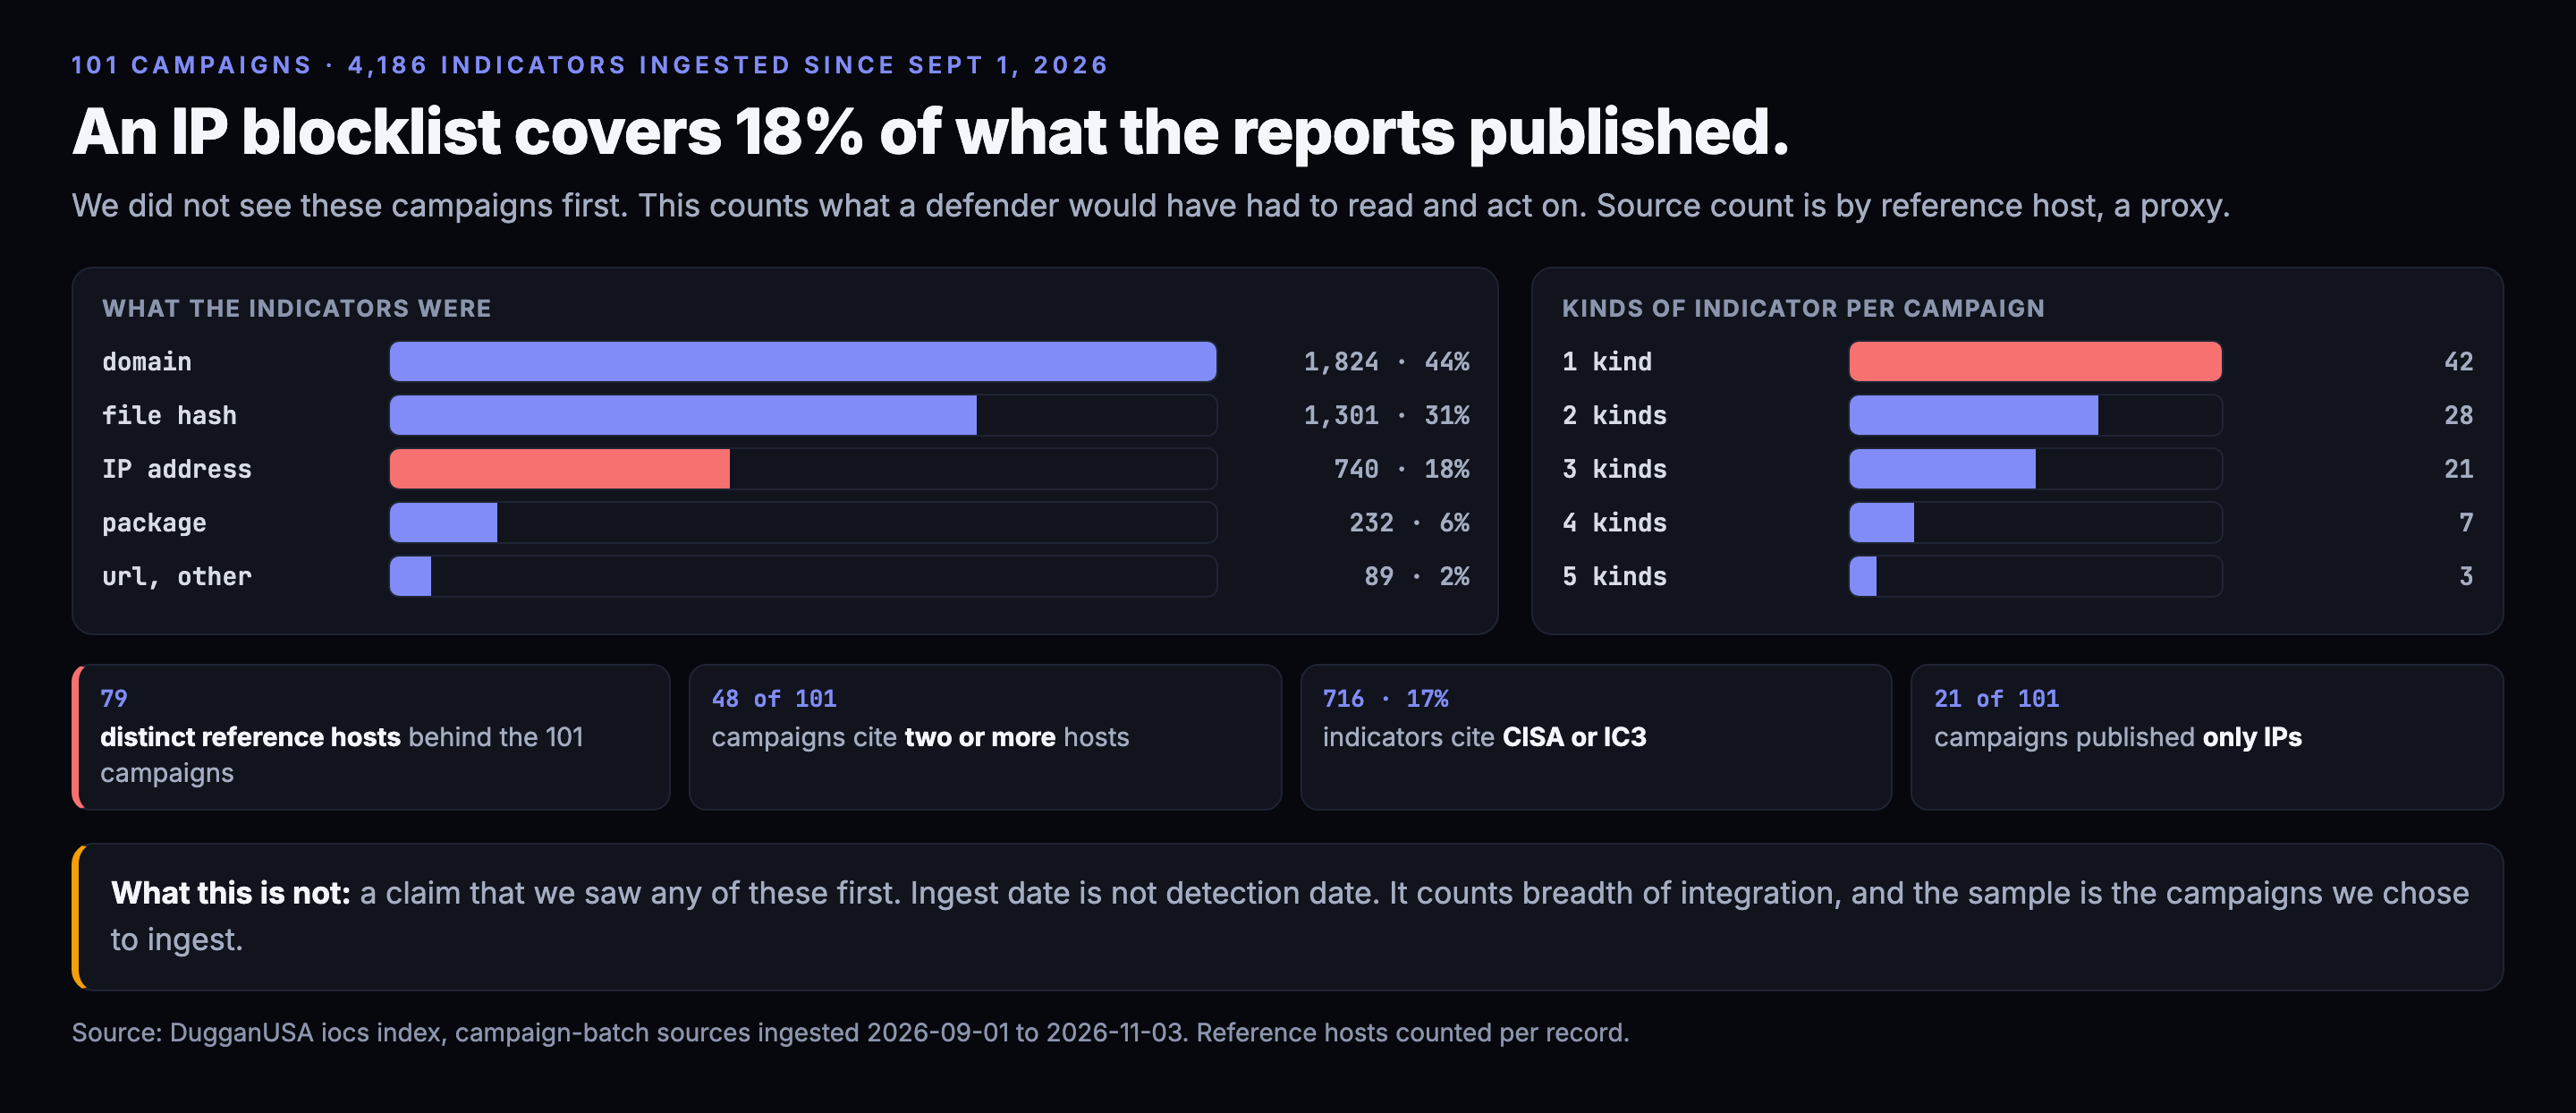
If your defense for a named campaign is an IP blocklist, it covers about one in five of the things the reports published. Of 4,186 indicators we ingested from 101 campaigns since September 1, 740 were IP addresses. The other 3,446 were domains, file hashes, malicious packages, URLs, crypto addresses and hostnames.
We did not see these campaigns first. This is a count of what a defender would have had to read and act on, and where it all ended up.
Four things a blocklist is not
Here is the split of what the 101 campaigns published.
- Domains: 1,824, or 44%.
- File hashes: 1,301, or 31%.
- IP addresses: 740, or 18%.
- Packages: 232, or 6%.
- URLs, crypto addresses, hostnames and emails: 89, or about 2%.
Twenty-one of the 101 campaigns published nothing but IP addresses. That leaves 80 campaigns where an IP blocklist alone misses something the report named. Fifty-nine campaigns carried two or more kinds of indicator, and 31 carried three or more. Three campaigns carried five kinds at once. One was a ClearFake campaign Talos documented: domains, hashes, IPs, URLs and a crypto address.
The packages matter most to anyone building with AI tools. A malicious npm or PyPI package is blocked at install time by a package check, not by anything on the network. Two hundred thirty-two of our indicators are in that class.
How many places you have to look
The 4,186 indicators cite 79 distinct reference hosts. That count is a proxy for sources and not an exact one. It includes github.com, which hosts indicator lists and reports from many authors, so it counts as one host that stands for many.
Fifty campaigns cite one reference host and 48 cite two or more. Two campaigns cite four. One CISA advisory alone gave us 650 indicators across domains, hashes and IPs.
Government sources carry real weight. 716 of the 4,186 indicators, 17%, cite CISA or the FBI's IC3 as a source. The rest come from vendors and researchers such as Gen Digital, Infoblox, Google Cloud, OX Security, Bitdefender, SOCRadar, Talos and Unit 42.
Most of that reaches a defender as prose, a PDF or a blog table. Reading 79 places to find indicators and then writing the rules is the job we do once, so a customer does not have to do it for each campaign. The output is three downloadable lists (IPs, domains, hashes), a package check and a check for MCP servers.
Does combining sources get closer to the truth?
We can check part of that against outside parties. These are our own measurements, from public endpoints, and each has a limit.
- Novelty. In a sample of 468 indicators we collected ourselves, 464 were not in ThreatFox, about 99%. The sample is stratified and small, and ThreatFox is one comparator.
- Accuracy. Over a rolling 30 days we submitted 907 IP addresses to Spamhaus. It independently listed 574 of them, 63.3%. The other 333 are still under review. None of the reviewed ones came back not listed.
- Liveness. In the last 30 days, 874 distinct indicators fired on real traffic, spread across seven source lanes. No single lane produced more than half of them. Our own canaries produced 428, an OTX-derived lane 285 and Spamhaus DROP 118.
The honest weakness sits in that last item. Of the 55,794 hits, 32,421 were on our own properties. The remaining 23,373 came from a single outside consumer. We have shown the feed blocks real traffic. We have shown much less about what it does for customers, and we will not pretend otherwise.
What we hold, and what we don't
Every number above is about indicators we ingested from other people's reports. None of it is a claim that we saw a campaign before its authors did. An ingest date is not a detection date, and the lists above include third-party sources by design. We also do not know how many of the 101 campaigns a given reader's tools already cover.
Limits
The 101 campaigns are the ones we chose to ingest since September 1, so the sample reflects our editorial choices. The reference-host count is a proxy, as above. Kinds of indicator come from the type field on each record, and a few records may be mistyped. The Spamhaus, novelty and liveness figures are from our public endpoints as of November 1 to 3 and move weekly. We have not yet measured how many of these indicators were already held elsewhere before each write-up. That pass is running and we will publish it when it finishes.
Five percent of this is wrong somewhere. It always is. The numbers will move again before you finish reading.
Was this useful? Rate this post. The widget is at the bottom of the page, and we read every response.
Every indicator in this post is in the feed. Free.
1.58M+ IOCs, STIX 2.1 / TAXII, 88% novel vs ThreatFox, exploited-CVE leads ahead of CISA. No credit card — a free API key in 30 seconds, and you can audit every claim above against the live endpoints.